Every day of the year EBMUD samples and tests your water extensively in laboratories and in the field to make sure it is safe to drink.
More than 20,000 annual laboratory tests ensure the safety of your drinking water and that all customers receive high-quality drinking water that meets or surpasses all state and federal regulatory requirements and standards.
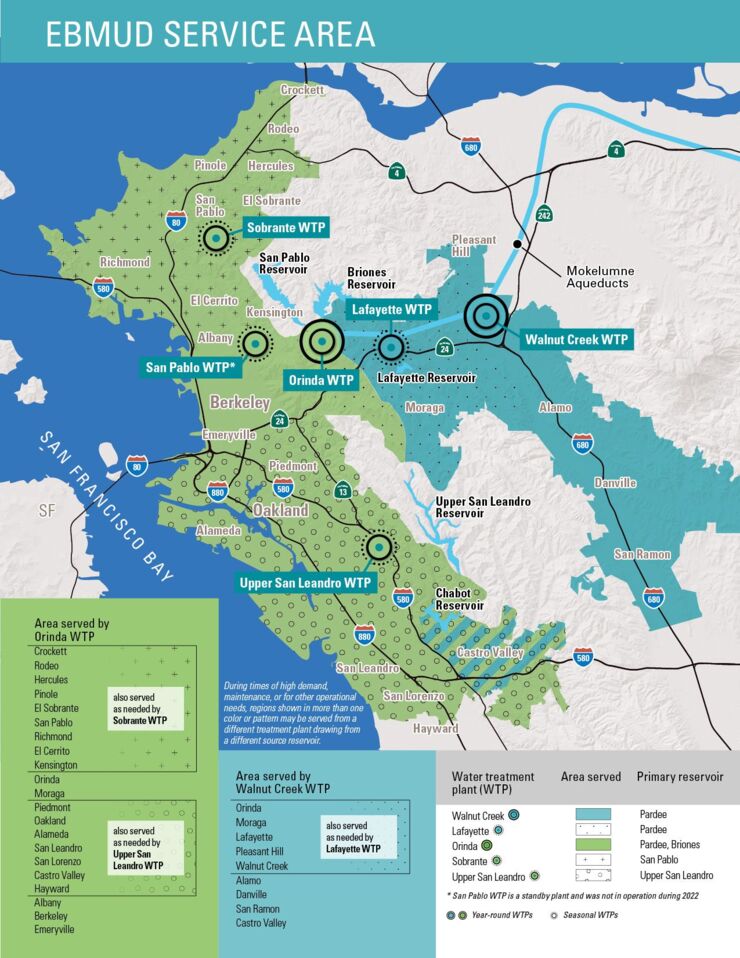
Every drop of water that comes out of your tap is first treated at one of our treatment plants. Scroll down to the map below, find your city and the corresponding treatment plant. Then find the column in the table for the most recent water qualtiy data from that treatment plant. OS means "Out of Service".
System water quality
| Treatment Plants | Lafayette | Orinda | Sobrante | Upper San Leandro | Walnut Creek | San Pablo |
|---|---|---|---|---|---|---|
| Chloramine (mg/L) |
2.36
7/4/2026 |
2.67
7/4/2026 |
3.74
7/4/2026 |
OS |
2.61
7/4/2026 |
OS |
| Fluoride (mg/L) |
0.73
6/30/2026 8:08AM |
0.78
6/30/2026 7:20AM |
0.74
6/23/2026 7:20AM |
OS |
0.72
6/30/2026 8:57AM |
OS |
| Hardness (mg/L) |
20
6/23/2026 8:05AM |
16
6/23/2026 7:30AM |
64
6/23/2026 7:20AM |
OS |
16
6/24/2026 9:30AM |
OS |
| Hardness (grains/gallon) |
1.2
6/23/2026 8:05AM |
0.9
6/23/2026 7:30AM |
3.7
6/23/2026 7:20AM |
OS |
0.9
6/24/2026 9:30AM |
OS |
| pH |
9.04
7/4/2026 |
9.37
7/4/2026 |
8.35
7/4/2026 |
OS |
9.29
7/4/2026 |
OS |
| Temperature (oC) |
19.28
7/4/2026 |
16.78
7/4/2026 |
18.28
7/4/2026 |
OS |
18
7/4/2026 |
OS |
| Total Dissolved Solids (mg/L) |
36.7
7/3/2026 |
36.6
6/30/2026 |
141
6/30/2026 |
OS |
45.64
6/30/2026 |
OS |
To convert the "Hardness" values into grains per gallon (gpg), divide the values shown in the tables in milligrams per liter (mg/L) by 17.
Sample results displayed are the most recent samplings available.
If you have questions regarding water quality data, please contact us at 1-866-403-2683. You may also refer to the Annual Water Quality Report for more information.
Where your water is treated